 Briefing
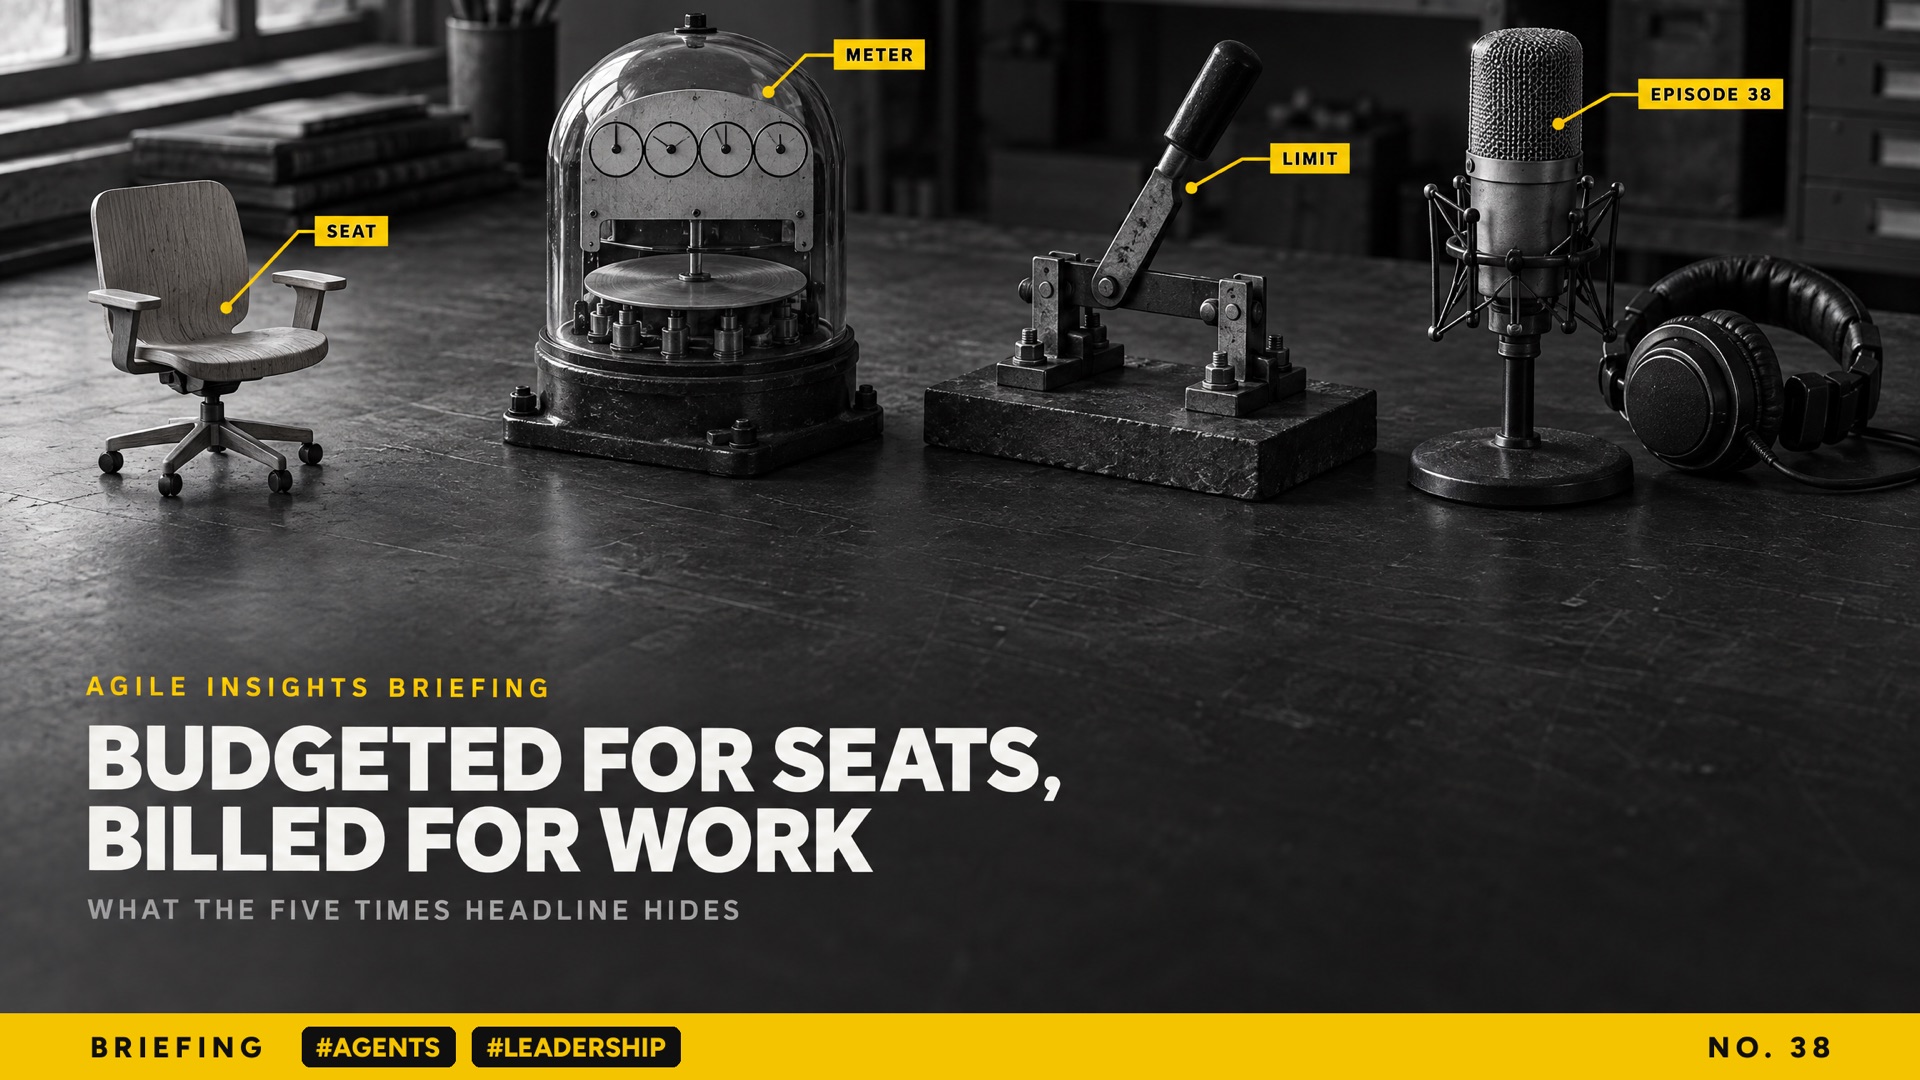
Episode 38 · Primer and discussion · About 12 minutes in two parts
Budgeted for seats, billed for work
Part 1: How AI is priced now · About 5 minutes
Download the MP3 · Linda and Leonard, AI voices, read a script written from the sources below.
Part 2: Reading the five times headline · About 7 minutes
Download the MP3 · Linda and Leonard, AI voices, read a script written from the sources below.
In this episode
01From a seat to a meterA seat is a fixed price per person. Models charge per million tokens read and written. Menlo’s example, Opus 5.5, costs four US dollars in, twenty out and twenty cents for cached text.
02Cheaper per token, bigger billMenlo found small model prices fell by eighty per cent or more, yet buyers moved to the dearest frontier models. Agents work alone and in parallel, so tokens rise much faster than the price falls.
03The average is not the typical companyMenlo’s average company planned 1.9 times and spent 4.7 times. The median planned 1.8 times and spent 2.2 times, about a fifth over plan. A small group of heavy users pulls the average up.
04Who wrote it, and what it cannot sayThe figures are Menlo’s estimates from an American survey and its own model, not audited revenue. Menlo invests in Anthropic and OpenRouter. The survey measures spending, not what the spending bought.
05What to doForecast by workload and expected token volume, with a trigger that reopens the forecast. Give every agent a named owner and a spending limit. Measure cost per completed task, and make results checkable before scaling.
Sources and links (2)
2026: The State of Enterprise AI · menlovc.com
Menlo Ventures, 3 November 2026. The report itself: a survey of nearly 400 US enterprise decision makers plus Menlo’s own market model. Menlo invests in several companies it names.
Menlo Ventures, 3 November 2026. The report itself: a survey of nearly 400 US enterprise decision makers plus Menlo’s own market model. Menlo invests in several companies it names.
Companies Are Spending 5x More on AI Now · aidailybrief.ai
The AI Daily Brief, 6 November 2026. Nathaniel Whittemore’s commentary on the report, and the source of the per seat against per token line.
The AI Daily Brief, 6 November 2026. Nathaniel Whittemore’s commentary on the report, and the source of the per seat against per token line.
Checked against Menlo Ventures’ report on 12 November 2026. Every figure is Menlo’s own estimate from a US survey and its market model, shown as a yearly run rate, not audited revenue, and Menlo invests in Anthropic and OpenRouter. Check the original before quoting.
Our fact check · 22 claims: 18 verified, 1 partly right, 3 unverified
Before we record, every claim the hosts make is checked against the sources (this table was last updated 12 November 2026). Confirmed means a primary source or two independent reports; Reported means one party says so; Partly right, Disputed, Unverified and Not yet known mean what they say, and the hosts say so on air. This is the table as we left it.
- VerifiedMenlo’s report (3 Nov 2026) rests on a survey of nearly 400 US enterprise decision-makers, fielded 8 to 26 Sep 2026.Menlo report; US only.
- VerifiedEnterprise AI deployment spend is about US$176.8B by Sep 2026, up 5.4x from US$33B.Menlo report; Annualised run rate from Menlo’s model.
- VerifiedGrowth accelerated: 5.0x in 2024, 3.9x in 2025, 5.4x in 2026.Menlo report
- VerifiedAverage spend per enterprise rose 4.7x against a planned 1.9x.Menlo report; Source of the “5x” headline.
- VerifiedMedian spend rose 2.2x against a planned 1.8x; a small group of heavy users explains the gap.Menlo report; The typical company overspent by about a fifth.
- VerifiedEnterprises using AI rose only from 55% to 65%.Menlo report
- VerifiedMenlo attributes the overspend to agents: spend scales with work, not headcount.Menlo report; AI Daily Brief; Menlo’s interpretation.
- VerifiedAgents generate 80% of tokens on OpenRouter; agent traffic up 37x since February 2026.Menlo report; OpenRouter skews to developers and startups.
- VerifiedFrontier models rose from 35% to 63% of spend despite small-model price cuts of 80% or more.Menlo report
- VerifiedThe most popular models moved to Opus 5.5 (US$4/$20) and GPT-6 Astra (US$10/$60).Menlo report
- VerifiedAnthropic 55%, OpenAI 31%, Google 9% of enterprise LLM API spend.Menlo report; Menlo invests in Anthropic.
- VerifiedOpen-source models are 19% of tokens but 4% of spend.Menlo report
- VerifiedCache reads can be 95% or more of an agent’s tokens; an Opus 5.5 agent session averages about US$0.70 per million tokens.Menlo report; Menlo’s worked example.
- Verified55% of incremental AI spend is new budget; 22% came from software budgets.Menlo report; The podcast said 21%.
- VerifiedCoding (US$34.0B) and chatbots (US$25.0B) are 76% of a US$77.3B app market.Menlo report
- VerifiedSpend concentrates where results can be checked: customer success up 4.3x, HR 2.5x, marketing 1.8x.Menlo report; Menlo’s reading.
- Partly rightIndependent coding companies grew from US$2.6B to US$7.8B.AI Daily Brief; Menlo says 2.9x to US$10.1B.
- UnverifiedFinancial-services apps grew 8x to about US$800M.AI Daily Brief; Not in the report’s text.
- VerifiedMenlo invests in Anthropic, OpenRouter and other companies named in the report.Menlo report; Disclosed.
- VerifiedPrior-year figures were reclassified to this year’s categories.Menlo report
- UnverifiedMenlo’s 2025 report gave US$37B for 2025, not US$33B.Press summaries; Not checked against the 2025 report.
- UnverifiedAnthropic had 12% of enterprise API spend in 2023.AI Daily Brief; Not in the report’s text.
Want to know more?
Sign up for our podcast at agile-insights.com.au.
Read the transcript · Part 1: How AI is priced now
Linda Here is the idea for today. A I used to be something you bought per person. With agents, it has become a meter that runs on the work done. So a budget built on headcount will be wrong, and often by a multiple. By the end of this part, you will know how the meter works, why a cheaper model can still mean a bigger bill, and the one change to make in how you plan for A I spending.
Leonard The reason this is on our minds is a report. On the third of November, the venture firm Menlo Ventures published its State of Enterprise A I report. It surveyed nearly four hundred decision makers in large American companies. The headline is that the average company spent four point seven times what it spent on A I last year. They had planned for about one point nine times. Menlo is an investor in some of the companies in its own figures, so treat the exact sizes with care.
Linda Which is quite a gap.
Linda Let me build this up in four steps. Step one is the old model, the seat. You pay a fixed amount each month for each person with a licence. The cost is easy to plan. Count the people, multiply by the price, and you are done. Most companies budgeted A I that way, because chat assistants were sold that way. A person can only type so many questions in a day, so the cost tracked headcount closely. That is the habit the numbers in this report broke.
Leonard So what replaced the seat? When people say the bill is now in tokens, what is a token, in plain terms?
Linda A token is a small piece of text, often just part of a word. Models are priced per million tokens, in three parts. What you send in, what the model writes back, and text it has already seen recently, which is cached and much cheaper. Menlo uses Anthropic's Opus five point five as its example. Four US dollars per million tokens in, twenty dollars out, and twenty cents for cached text. That is step two. You no longer pay for a person. You pay for every piece of work the model reads and writes.
Leonard Twenty dollars out. Noted.
Leonard And step three is where agents come in. A person chatting with an assistant stops at lunch and goes home at night. An agent does not. It works through a task on its own, calls tools, reads the results, and tries again. Several can run at once. Menlo's explanation for the overspend is exactly this. Spending now scales with work rather than with headcount. On one public model gateway, OpenRouter, agents now produce about eighty per cent of all tokens.
Linda Step four is the part that surprises finance teams. Price per token is not cost per task. Menlo found that prices for small models fell by eighty per cent or more. Yet buyers moved the other way, to the dearest frontier models, because those are the ones that can carry long tasks. And because agents reread so much cached text, the average price per token actually falls as agents do more. The bill still rises, because the number of tokens rises much faster than the price falls.
Leonard Cheaper per token, bigger bill.
Leonard So the common belief is that a per seat budget puts a ceiling on A I costs, and that switching to a cheaper model brings the bill down. Is that wrong?
Linda Both are wrong once agents run. A seat licence caps what a person can do in a chat window. It does not cap an agent working through the night on a metered account. And a cheaper model that needs three times as many attempts to finish a task can cost more per task than a dearer one that finishes first time. The unit that matters is the cost of a completed piece of work. Tokens and seats are only ways of getting there.
Leonard Which brings us to governance. If the spending follows the work, then the person who owns the work has to own the spend. For an agent, that means a named owner, a spending limit set on that agent, and a forecast based on how much work it will do, not on how many staff the team has. When the volume of work changes, the forecast changes with it. An organisation that cannot say which agent spent what cannot say whether the money was well spent.
Linda Hm. Exactly right.
Linda So here is what to do. Plan A I spending by workload and expected token volume, not by seats. Give every agent an owner and a limit. Set a trigger that reopens the forecast when volume moves. And measure cost per completed task, not price per token. In Part 2, we look harder at the report itself, including what the five times headline hides.
Linda If you'd like to know more, sign up for our podcast at agile-insights.com.au.
Leonard Thanks for listening.
Read the transcript · Part 2: Reading the five times headline
Linda Here is the idea for this part. Companies planned their A I spending as if it were bought per person, and agents billed them for work instead. The headline says spending went up five times. For most organisations the real lesson is smaller and more useful. Your forecast is built on the wrong unit. By the end, you will know what the report actually measured, how to read its numbers, and what to change in how you govern A I spending.
Leonard A quick recap for anyone who skipped Part 1. A seat is a fixed price per person. A token is a small piece of text, and models charge per million tokens read and written. Agents work on their own, run several at once, and keep going after people leave, so they use far more tokens than a person chatting. The report is Menlo Ventures' State of Enterprise A I, published on the third of November. It rests on a survey of nearly four hundred decision makers in American companies, run in September, plus Menlo's own market model.
Linda Let me lay out the three facts the debate depends on. First, Menlo estimates enterprise spending on using A I at about a hundred and seventy seven billion US dollars a year, five point four times last year, and growth sped up rather than slowed. Second, the share of companies using A I barely moved, from fifty five to sixty five per cent. So this is depth, not breadth. Third, the average company planned to grow its A I spending one point nine times and actually grew it four point seven times. That is roughly two and a half times its plan.
Leonard And this is where the headline needs a second look. The four point seven is an average. Menlo also reports the median, the company in the middle. That company planned for one point eight times and spent two point two times. So the typical organisation overspent its plan by about a fifth, not by a factor of two and a half. Menlo says the difference is a small group of very heavy users pulling the average up. The direction holds for everyone. The size depends a great deal on which kind of company you are.
Linda A fifth. That changes the story.
Linda Then there is who wrote it, and how. This is what is confirmed and what is not. The figures are Menlo's estimates, from a survey and a model, shown as yearly run rates, not audited revenue. The survey is American only. Menlo discloses that it invests in Anthropic, which it puts at fifty five per cent of enterprise model spending, and in OpenRouter, the gateway behind its figures on agents. None of that makes the numbers wrong. It does mean you quote the direction with confidence and the exact sizes with their source attached.
Leonard So how should we read the overspend? I see three positions. The first says this is runaway cost. Companies switched on agents, nobody set limits, and the bill arrived. The second is Menlo's view, and also Nathaniel Whittemore's on The A I Daily Brief, which covered the report. It says this is organisations learning what the capability can do, and the heavy spenders show where everyone else is heading. Whittemore put it neatly. We planned for per seat A I and got per token A I.
Linda Neatly put.
Linda And the third position is the one I would argue for. The report cannot tell you which of the first two is true for you, because it measures spending, not what the spending bought. A team whose agents finished more work at a lower cost per task may have overspent its budget and still done well. Another may have paid for agents looping on tasks nobody checked. The difference only shows if you measure cost per completed piece of work, and know which agent did it...
Leonard I would push back a little there. Saying it depends can let everyone off the hook. Menlo's own data points somewhere. Spending grew fastest where results can be checked. Coding grew nearly eight times, because a compiler and a test tell you whether the work is right. Customer success grew over four times. Human resources and marketing, where the work is harder to check, grew more slowly. So money follows checkable work. I would take that as a signal, not just a neutral finding.
Linda That is fair, and it settles the disagreement. Menlo reads its numbers that way too, though it is reading its own data. If spending pays where results can be checked, then the work to do before spending more is to make results checkable. Define what a good outcome looks like for each agent and test for it. Then the question of whether the overspend was waste or value has an answer, agent by agent, instead of an argument.
Leonard Two more things from the report matter for governance. The first is the unit trap. Open source models carry about nineteen per cent of tokens but only four per cent of spending. Read by tokens, open source is surging. Read by dollars, it is shrinking. The same goes for average against median. Before any figure goes into a business case, ask which unit it is in and which statistic it is. The second is concentration. Two labs now take most of the spending, which makes supplier exit a real planning question.
Linda Same market, opposite readings.
Linda So here is what to do. First, rebuild the A I forecast on workload and expected token volume, not headcount, with a trigger that reopens it when volume moves. Second, give every agent a named owner and a spending limit set on the agent itself. Third, measure cost per completed task, so you can tell value from waste. Fourth, make results checkable before you scale spending into new work. And when you quote this report, quote the median for a typical organisation, and name the source.
Linda If you'd like to know more, sign up for our podcast at agile-insights.com.au.
Leonard Thanks for listening.
More on #agents
Episode 23 · Primer and discussionWhat FDE means at OpenAI: skills, not custom code.Episode 37 · PrimerWhat is an AI skill (and why you should care)Episode 36 · Primer and discussionChecking agents in production, even when you can’t read their workEpisode 33 · Primer and discussionAgents in production: the platform runs it, you still own itEpisode 29 · Primer and discussionCrowdStrike Uncovers New Agentic AI CampaignsEpisode 26 · Primer and discussionThe agent that speaks first: what to decide before proactive agents reach work accounts.
All of the briefings (38) · Follow Briefing in Apple Podcasts or any podcast app
Everything from Agile Insights: briefings, Making You Think and the reference series